Industry · Construction and real estate
Construction and real estate: earned value · CPI by line item · payment certificates · deed closing
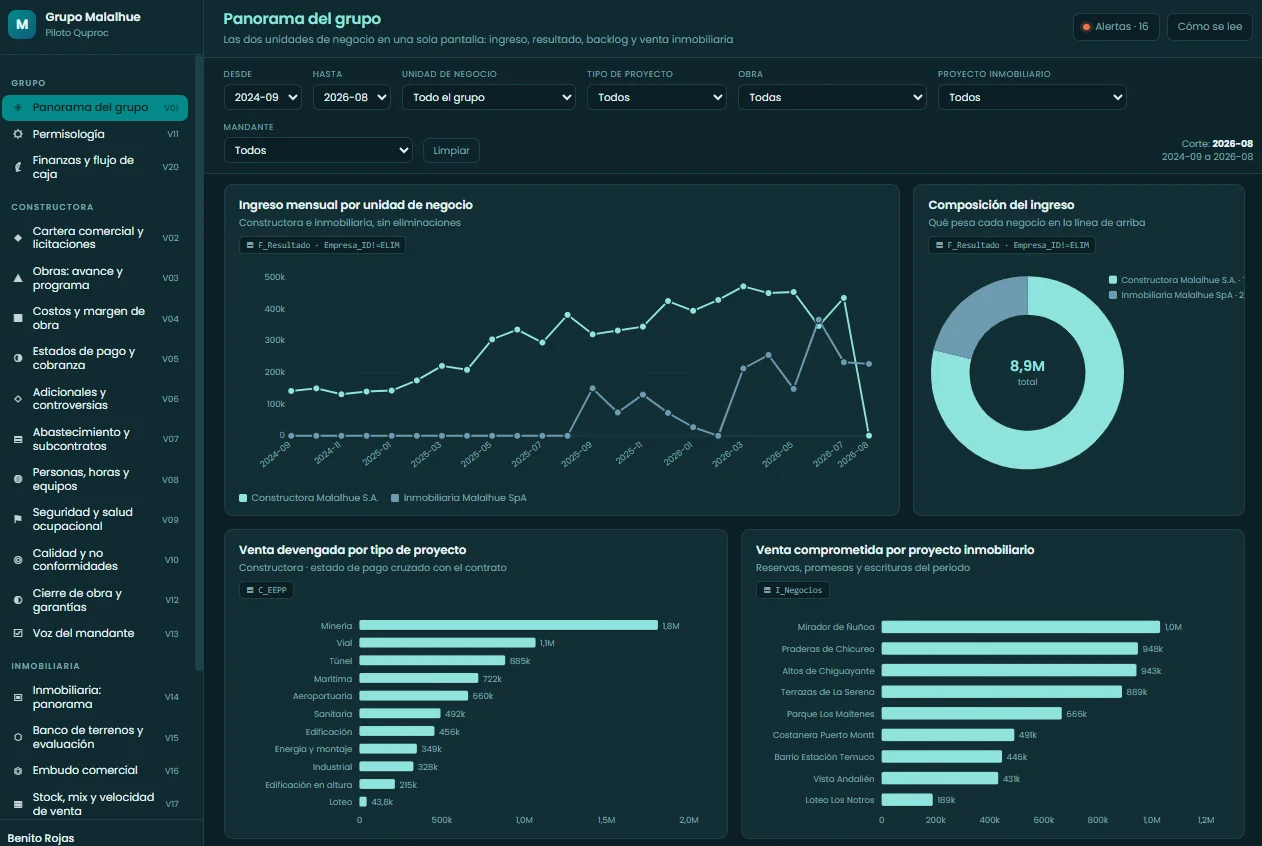
Physical progress, real cost, payment certificates and permits by project and by unit, with the margin that leaks priced and every figure traceable to its source.
What it measures
Earned value · CPI by line item · payment certificates · deed closing.
The views it generates
Projects: progress and schedule: S-curve, earned value, schedule and cost indices, contractual milestones and a Gantt chart of the portfolio. The gap between planned and actual progress, priced project by project.
Project cost and margin: target budget against real cost over the same executed progress. Cost overrun by line item in a Pareto, waterfall by line-item group and heat map by project.
Payment certificates and collections: what is invoiced, what is under observation and what is still to be collected. Approval and payment days by type of client, accumulated retentions and the reasons the file comes back.
Permits: construction and real estate procedures with their authority, their stated lead time and their actual lead time. The permits holding up a project start or a deed closing today, in one list.
Sales funnel: from lead to handover, stage by stage, counting real rows rather than assumed rates. Cost per lead and conversion by channel, reasons quotations are lost and sales-room performance.
After-sales and NPS: what breaks, who answers, how long it takes and what the client thinks afterwards. After-sales cost per unit handed over: the real price of a rushed handover.
Where the data comes from
What is already recorded comes in: payment certificates, the target budget by line item, the site log, purchase orders, subcontract agreements, safety records, quality protocols, permit files, sales spreadsheets and after-sales tickets. What today lives spread across twenty spreadsheets and three systems, cross-referenced in one.
The physical progress of a line item, its real cost, its payment certificate and the permit that enables it are the same number seen from four sides. When the cost index drops below 1, the dashboard shows in which line item, with which supplier and in which month it started.
Alerts that fire on their own
Alert rules editable from a cell: critical permits held up, projects with CPI below 1, disputed variations, late purchase orders that later show up as a stalled work front, guarantees about to expire, after-sales past its deadline and rejected subsidies with a risk of withdrawal.
- CRITICALA held-up permit is stalling the start of a project, and the delay is already priced in the curve.
- WARNINGStructural concrete concentrates 753k of planned value not yet executed.
- INFOThe portfolio schedule index came in at 0.96: earned progress is running below plan.
One engine, every industry
What changes between modules is the unit the industry already decides with and the thresholds that trigger its alerts. The calculation layer, the traceability and the delivery are identical. How the model works, in four stages.
This module falls under the same plans as the rest. See plans and pricing.
Other industries modeled
Send us one payment certificate and a project budget and we will show you what comes out of it.
Thirty minutes are enough to see whether your operation fits the model already built or whether it is worth adjusting it to your clients and your projects. No cost and no commitment.