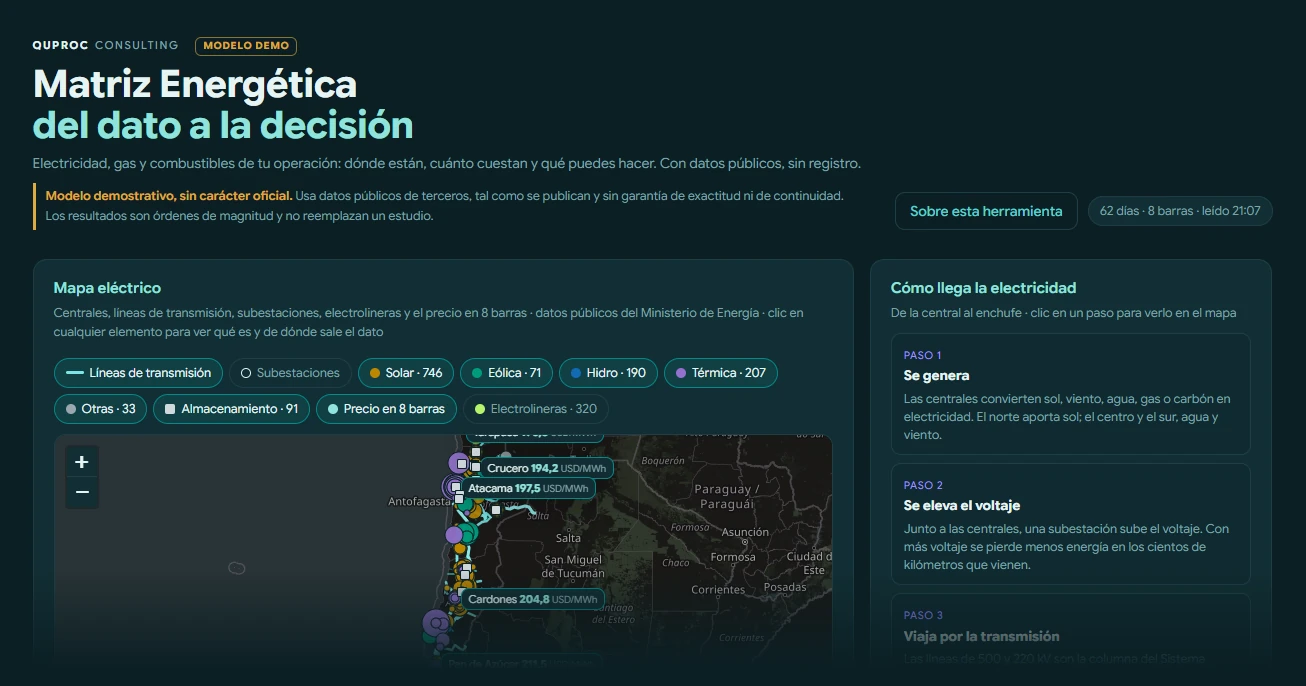
Energy Demo model
Energy Matrix
Hour-by-hour marginal cost, regulated tariffs and a simulator by industry and region, with data from the National Electric Coordinator, the Ministry of Energy and the CNE.
Open the demo model ↗How it is built
Management control
Process mapping, management dashboards and scenario simulation.
Three stages you can take separately or one after another. Pick your industry and see an example of each: the process, the dashboard and the simulator change with one click, and one more click takes you back to the general view. In your company they are built with your own stages, your indicators and your variables.
Pick your industry
Explore it with real data
Five models built on Chilean public data, plus the web app from a real case with sample data. They open without sign-up and are in Spanish.
How they are built →

Environmental assessment Demo model
SEIA Chile
More than 17,000 projects in five sectors that went through the SEIA: what gets approved, where, who is behind it and which permits they need.
Open the demo model ↗How it is built

Territory Demo model
SEIA and infrastructure map
The same SEIA projects on the map, next to substations, lines, pipelines, terminals and mining sites, with each one’s distance to what is nearby.
Open the demo model ↗How it is built
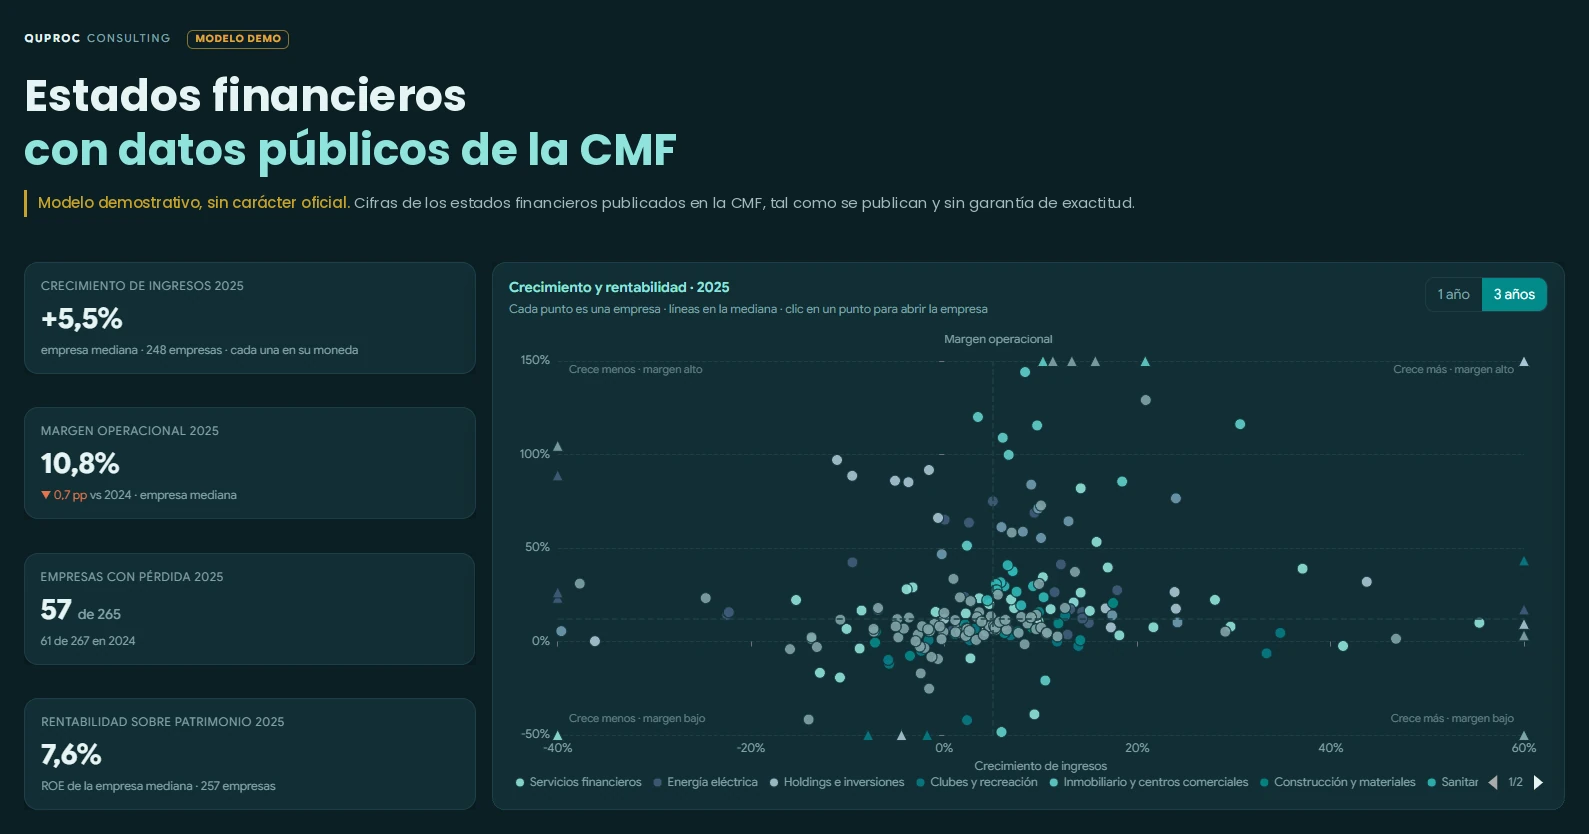
Finance Demo model
CMF financial statements
The IFRS statements published by the CMF, in one chart of accounts and with the same indicators for every company. Each figure opens its source.
Open the demo model ↗How it is built

Salmon farming Benchmark
Chilean salmon farming benchmark
What each producer publishes, site by site: 24 indicators across 5 dimensions, with data from Sernapesca, the SMA, Subpesca, the CMF and each company’s reports.
Open the benchmark ↗How it is built

Agriculture · real case Sample data
Yield potential by block
The web app from the AgroalCubo case, with sample data: NDVI, nutrient balance, harvest and fruit size for each block, year by year, and its gap against potential.
Open the demo version ↗Read the case
01 · Mapping
Before you measure a process, you have to be able to structure it.
Some operations are not ready to connect data yet: the record changes depending on who keeps it, the same figure is keyed in twice, or nobody quite knows where the number that reaches the board comes from. For those, the work starts one step earlier. One process is mapped with the people who run it, structured exactly as it works today and left ready to be measured.
The boundary
We do not design the technique of your operation: not the blast, not the concrete pour, not the packing line. We structure the management flow: who does what, with which record and in what order. Technical judgment and the decision stay with the team that knows the business.
Fixed price
Mapping one process
One management process from end to end: from purchase request to payment, from receipt to delivery, from a case coming in to its close. It ends with indicators ready to be measured, not with a diagnosis to file away.
- Scope
- One process, end to end
- Timeline
- 2 weeks
- Your team
- 4 one-hour meetings
- Price
- US$ 2,000before taxes · fixed price
What you get
- The map of the management flow. Every stage with its owner, the data source and the status of the record, exactly as it works today.
- Where the data gets lost. What is keyed in twice, the stages with no owner and the decisions made without data.
- The indicator sheet. Each indicator with its owner, the source it comes from and the threshold that fires it. Without this sheet the mapping is not finished.
- The tables that would be connected. The exact list and its count. That number sets the plan, if you later want to see the process in a dashboard.
Scope and price are closed before starting. Your team gives four one-hour meetings; the build-out is on Quproc. If you then connect the dashboard, the sources, indicators and thresholds carry over as they are into the setup.
Let’s talk about your process ↗Includes
- One management process, with its start and end agreed in writing before starting.
- Four one-hour meetings with your team, online, within two weeks.
- The flow map, the indicator sheet and the list of tables, with one round of adjustments.
Does not include
- Designing the technique of your operation or implementing the changes.
- Connecting data or building the dashboard: that is modeling, with its own price.
- A second process or extra meetings: they are quoted before they are done.
If meetings slip because of calendars, the timeline moves, not the price. The mapping is not credited against the dashboard setup. The mapping in detail.
02 · Modeling
Four stages. Data travels one way.
Not a diagram: it is what happens to every file from the moment it leaves your system until it shows up on the dashboard. Press play, or click the stage you care about.
⚿ Every dashboard is private. Each user signs in with their own password, sees only the sites, units or assets that correspond to them, and every session is logged. That is why the full demonstration is done live, over sample data. 100% Google Workspace · one web app per company · access from your phone.
We receive data, not access
Quproc never enters your ERP and never asks for credentials. Your own systems send what they already produce, in one direction and to a single destination.
Flat monthly fee
You pay for the dashboard, not for people. The whole team that needs to see it gets in, with no per-user licenses and no headcount tiers.
From indicator to document
Every figure opens the row that produced it and the document behind it, in one click and without leaving the dashboard.
Zero migrations
Systems stay where they are and nobody changes tools. If the data is already recorded once, it is never asked for again.
It does not replace Excel or your BI tool: it uses them as a source. These are the four questions that come up first. The full comparison, row by row.
Excel and Google Sheets files
The spreadsheet is not thrown away: it is read. What is copied and pasted by hand becomes automated, KPIs recalculate on every load, and each figure opens the cell behind it.
Power BI, QlikView, Tableau
Quproc does not compete with the BI tool or ask for it to be dropped. It receives what the company already exports and returns a dedicated dashboard, with no per-user licences.
The ERP and industry systems
There is no integration to approve and no credentials to hand over. The systems send what they already issue, one way only, and the data is available in real time.
The report built by hand
Indicators recalculate on their own and threshold alerts fire without being asked, so margin and cost per unit do not wait for month-end close.
The modules
Every module is built on its industry’s journey and runs as a web app.
The web app demos, one per industry, in PDF (in Spanish). Figures are for demonstration; the structure is what gets installed.
The monthly plan
The price depends on how many tables stay connected.
Each table is a set of columns that gets mapped at the start and kept alive every time the source changes, whether it refreshes every hour or once a year. You pay for the dashboard, not for the people.
| Plan | Connected tables | Monthly price | Setup |
|---|---|---|---|
| Base | Up to 10 | US$ 500 | US$ 750 |
| Standard | 11 to 25 | US$ 750 | US$ 1,250 |
| Advanced | 26 to 50 | US$ 1,000 | US$ 1,750 |
| Custom | More than 50 | fromUS$ 1,250 | from US$ 2,250 |
| Groups | Several sites or legal entities | Scope is set during the initial review | |
Before taxes · the monthly price applies to every industry
Monthly plan termssetup · what it includes and what it does not · term · exit
Above 50 Custom starts at US$ 1,250 a month and US$ 2,250 for setup, and includes up to 50 tables. From table 51 onwards, each table adds US$ 10 a month and US$ 25 to setup, with no cap.
How it counts Every table with its own set of columns counts, wherever it lives. Three tables stacked on one sheet are three, because they are three mappings. The same table split by year or by month across several tabs is one. Everything that stays connected counts, however often it refreshes.
Term The plan is set during the initial review, looking at how the files actually arrive, and stays fixed for twelve months. On the anniversary both volume and rate are reviewed; in between, nothing changes.
Exit The service can be ended at any time with 30 days' notice. There is no minimum commitment and no exit fee.
Continuity The repository and the model live in your company's Google Workspace, under your own administrator. If the service ends, the data, the spreadsheets and the dashboard stay where they are.
Remote Distance is not a constraint and there is no travel to bill. The initial review, the validation of figures and the reviews all happen online, scheduled in your time zone. The dashboard is a web app: it is opened from wherever the person is.
Setup
from US$ 750
Charged once, at the start, and it grows with the plan: configuring ten tables is not the same as configuring two hundred. It covers the review of the sources, the column mapping, the validation of the figures against your own reports and the publication of the dashboard. If a process was mapped beforehand, setup starts with the sources and indicators already defined; its price is the same.
It is the only one-off charge. Once the dashboard is up, only the monthly price runs. A pilot is charged as the Base setup and credited if it moves to production.
What the monthly price includes
- Unlimited users. The plan is not charged per person: the whole team that needs to see the dashboard gets in.
- Loading and refreshing every agreed source.
- Dashboard maintenance when the source spreadsheets change: columns that move, new formats, years that come in.
- Cosmetic adjustments to the views that already exist: a filter, a sort order, a label, a color.
- Reconciliation checks, so the dashboard totals match your own reports.
- Support by email during business hours.
What it does not include
- A new view, an indicator with a new rule, a projection or an integration with another system: they are quoted separately, as a special project.
- Keying in data or correcting it in your systems: if a source arrives with errors, the dashboard shows it and you get a warning.
- Tables that were not in the plan: if tables added during the year change the plan, we talk before connecting them.
Prices are in US dollars and before taxes. Quproc invoices from Chile: international transfer fees, currency conversion and any withholding that applies in your country are on the client's side.
02 · Modeling
Send us one of your spreadsheets and we’ll show you what comes out of it.
Thirty minutes is enough to see whether your operation fits one of the models already built or whether it is worth modeling from scratch. No cost, no commitment.
03 · Simulation
With the operation modeled, you can simulate what comes next.
Simulation runs on the same system as the dashboard: the same sources, the same model and the same web app. What gets added is work with your team to decide which variables to move, with which rules and in which scenarios. That takes advisory and consulting hours, which is why it is quoted as a special project.
Projections and scenarios
Year-end close, cash flow or demand, with a base, a stress and an upside scenario, compared against what has been published.
Simulators
Move a variable, such as price, volume, headcount or rate, and see the effect on margin, on cash and on covenants.
Custom engines
When the formula that decides belongs to your operation: irrigation by depth and water potential, yield potential with NDVI, nutrition programs from lab analysis, or the business model of a whole company.
Try the simulator of any of the 21 industries
With public data
The same method, on data anyone can look up. Five models, no sign-up.
Operations · EnergyEnergy MatrixMarginal cost, tariffs and a simulator by industry and region.See the model →
Investment · Environmental assessmentSEIA ChileMore than 17,000 SEIA projects, the moment each one is in and the permits it will probably need.See the model →
Territory · InfrastructureSEIA and infrastructure mapSEIA projects over the country’s infrastructure, filtered by proximity.See the model →
Finance · Financial statementsCMF financial statementsIFRS statements in one chart of accounts. Each figure opens its source.See the model →
Industry · Salmon farmingSalmon farming benchmarkWhat each producer publishes, site by site, in 24 indicators.See the benchmark →
All public data models →
Includes
- What the quote says: variables, scenarios, deliverables, timeline and estimated hours.
- Advisory to define the assumptions with your team.
- Once delivered, the simulator stays in your web app and the monthly plan maintains it when the sources change.
Does not include
- Anything that is not in the quote: a change of scope is quoted before it is done.
- Changing the rules or adding variables after delivery: that is new work.
- A prediction: the simulator shows the effect of the assumptions your team defines.
It runs on an operation already modeled in a dashboard: if it is not yet, that is where it starts. How a simulation project works.
Special project · custom quote
It is quoted by looking at your data, not at a price list.
Estimated hours, deliverables and timeline, on top of the model that is already running. If the operation is not modeled yet, it starts with the dashboard. The initial review is free.
The method
01 · MappingIf you can draw a system, it is because you understand it. If you understand it, it is because you know it.
02 · ModelingIf you know it, it is because you measure it.
03 · SimulationIf you measure it, it is because you can simulate it. If you can simulate it, it is because you can improve it.
Industry
Pick your industry and see its case.
Every model came out of a conversation with someone who already had the problem, and was built on the files that company was already issuing. When you pick an industry the whole page changes: the sample process, the dashboard, the simulator and the case.
Cases
Two clients, told from start to finish.
What each one needed, how we built it and what changed, with the numbers.
GVIC · Environmental assessmentEmails to SEA project owners, on technical and legal grounds5 daysfirst 5 emails0corrections100more in reviewFinding the projects with DGA or DOH observations and writing to each owner. A web app on the SEA, a shared spreadsheet and an AI assistant.Read the case →
AgroalCubo · AgricultureYield potential reports, from 40 days to 2−95%reporting time+25%yield potential38 dayslead timeMore than 4,000 hectares of d’Agen plums in one database, with each grower’s report generated with one button.Read the case →
All cases →
Who is behind this
Benito Rojas Philippi

Process consultant. Industrial Civil Engineer with a postgraduate diploma in Quality and Productivity Management. He designs and builds the dashboards himself: whoever maps the process is the same person who writes the model.
- More than 10 years leading operations, commercial and after-sales teams.
- Continuous improvement and operational efficiency across industrial sectors and B2B services.
- Ultramarathon runner (100k+), mountaineer, road and mountain cyclist, drummer.
Next step
Send us one of your spreadsheets and we’ll show you what comes out of it.
Thirty minutes is enough to see whether your operation fits one of the models already built or whether it is worth modeling from scratch. No cost, no commitment.