Industry · Insurers
Insurers: earned premium · loss ratio by cohort · 13-month persistency
Premium, risk elapsed, claims and collections by policy, with portfolio lapse priced and every figure traceable to its source.
What it measures
Earned premium · loss ratio by cohort · 13-month persistency.
The views it generates
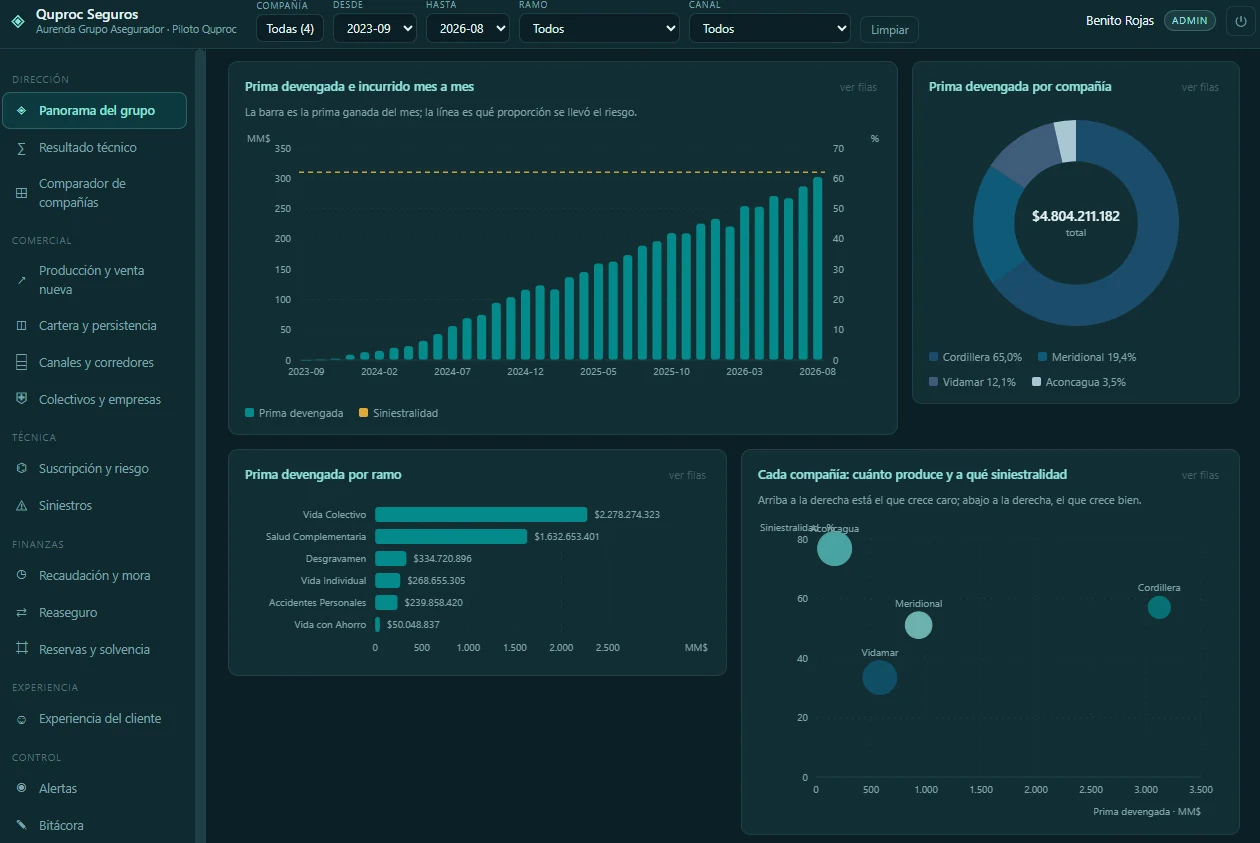
Group overview: earned premium, loss ratio, combined ratio and technical result of the four companies, with the detail of which grows expensively and which grows well.
Production and new business: the full funnel from quote to issued policy, with the recorded reason for each lost opportunity and conversion by channel.
Portfolio and persistency: additions, exits and persistency by issue cohort, separating voluntary cancellation from lapse for non-payment.
Channels and brokers: production and portfolio quality on the same plane. The broker who sells the most is almost never the one who leaves the portfolio that persists the longest.
Claims: from notice to payment, step by step. Settlement days are not a loaded figure: they are the sum of the pipeline steps, and it shows which one consumes the time.
Reserves and solvency: unearned premium, claims payable and IBNR month by month. IBNR is not a table factor: it is the claims incurred before the cut-off and reported after it.
Where the data comes from
What is already recorded comes in: policies and endorsements, installments and collections, claims with their settlement, group scheme member lists and the commission settlements of each broker. It is all in the core system already; the module asks for nothing new to be captured.
Written premium, earned premium, incurred claims, expenses and commissions sit on the same screen. The loss ratio is measured against the premium actually earned, not against the premium billed, and the technical result of the four companies is read over the same period.
Alerts that fire on their own
Thresholds configurable by company, line of business, channel and broker. Arrears on the first installment anticipate the policy lapsing; 13-month persistency by broker shows which production costs more than it returns. The alert rules live in an editable sheet.
- CRITICALTelemarketing with a loss ratio of 93.8%: the mass channel comes in cheap and goes out expensive.
- WARNINGThree categories above 100% of budget execution: claims handling, technology and marketing.
- INFOExecutive group life at a 91.4% loss ratio against 44.0% for supplementary hospital health.
One engine, every industry
What changes between modules is the unit the industry already decides with and the thresholds that trigger its alerts. The calculation layer, the traceability and the delivery are identical. How the model works, in four stages.
This module falls under the same plans as the rest. See plans and pricing.
Send us one month of installments and claims and we'll show you what comes out of it.
Thirty minutes are enough to see whether your company fits the model that is already built or whether it is worth adjusting it to your lines of business and your channels. No cost and no commitment.