Industry · Car dealership
Car dealership: service bay hour · delivery promise · CLP per lost labor hour
Shipment, yard, workshop and after-sales by branch, with the lost service bay hour priced and every figure traceable to its source.
What it measures
Service bay hour · delivery promise · CLP per lost labor hour.
The views it generates
Overview: efficiency, service bay hours lost, delivery promise compliance and margin on a wall of eight indicators, with the unit's journey from ship to handover.
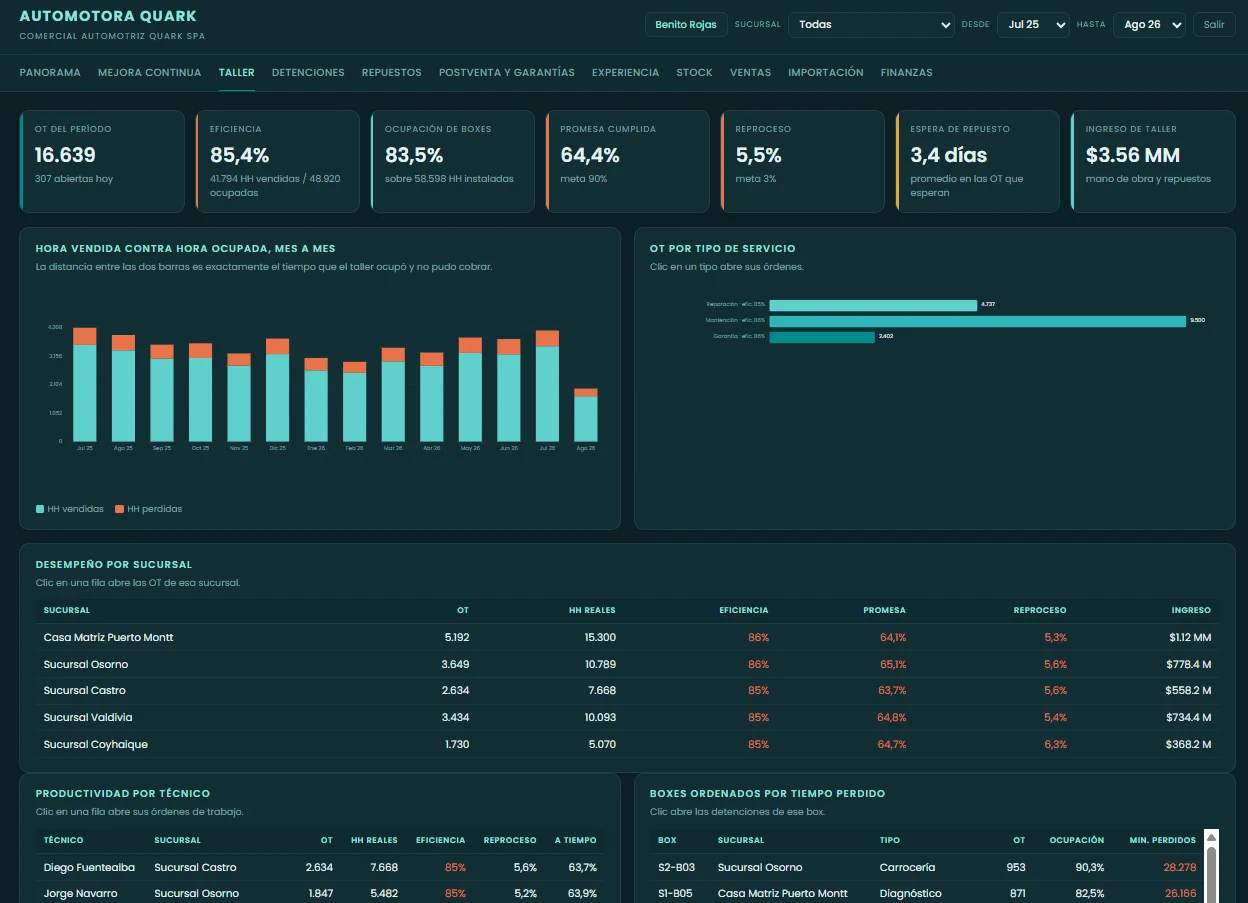
Workshop: hour sold against hour occupied, service bay occupancy against installed capacity and rework, branch by branch and technician by technician.
Stoppages: Pareto of lost service bay time, with the cause, its category, whether the company controls it and what it is worth at the labor-hour sale rate.
Continuous improvement: each indicator against its target, PDCA cycle, stated root cause, standard adoption and savings captured by process.
Import: ETA compliance shipment by shipment, customs channel, days in port and port storage.
After-sales: warranty cost by system, factory reimbursement, days to resolution and appointment retention, with the comment from each detractor.
Where the data comes from
What is already recorded comes in: DMS, work orders, stockroom and parts control, the service calendar, the exit survey and the customs file for each shipment. No data migration and no change of platform.
Every service bay hour is tracked from intake to handover. The hour sold against the hour occupied, and the difference broken out by the cause that produced it, bay by bay and technician by technician.
Alerts that fire on their own
Thresholds configurable by branch, service bay and technician. Efficiency below target, a work order delivered late, an improvement action past its committed date and a unit over ninety days in the yard are flagged on their own.
- CRITICALDelivery promise at 64.4%: twenty-five points below the target of 90%.
- WARNINGRework at 5.5% against a 3% target, and 3.4 days average waiting for parts.
- INFOParts in transit is the top cause in the Pareto of lost service bay time.
One engine, every industry
What changes between modules is the unit the industry already decides with and the thresholds that trigger its alerts. The calculation layer, the traceability and the delivery are identical. How the model works, in four stages.
This module falls under the same plans as the rest. See plans and pricing.
Send us one month of work orders and we'll show you what comes out of it.
Thirty minutes are enough to see whether your operation fits the model that is already built or whether it is worth adjusting it to your branches and your service mix. No cost and no commitment.