Industry · Distributor network
Distributor network: churn index · volume at risk · sales coverage
The distributors that carry the business, ranked by what each one has stopped buying before the drop shows up in invoicing.
What it measures
Churn index · volume at risk · sales coverage.
The views it generates
Portfolio: volume, invoicing, delivery fleet and OTIF across the whole network, month by month.
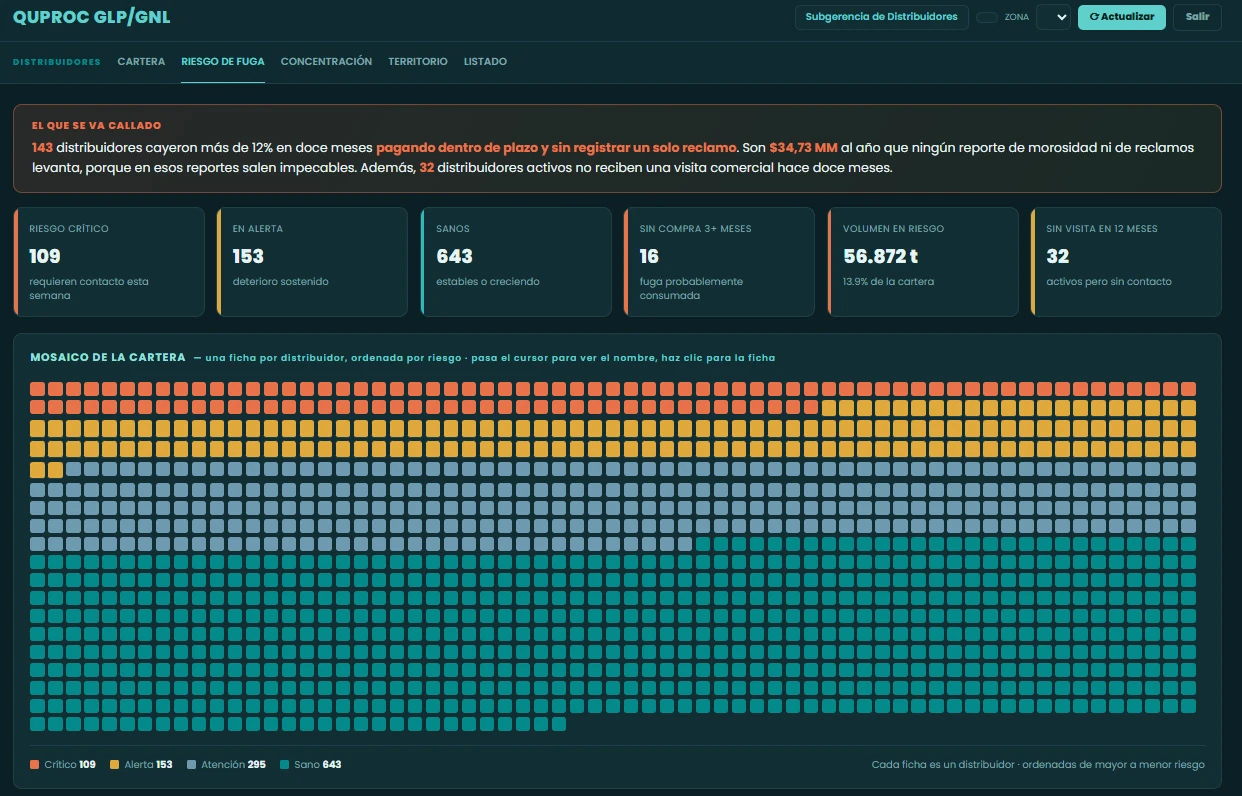
Churn risk: one panel per distributor, ranked by churn index.
Concentration: how much volume each decile moves, the large accounts and the long tail.
Territory: volume and average risk by region and municipality.
List: the distributors one by one, sortable and filterable, each row with its record.
Custom views based on the data and requirements of each client.
Where the data comes from
What is already recorded is what comes in: deliveries and delivery notes, invoicing and payment terms, the complaints log, the sales visit register and the record of each distributor. It feeds off the system the company already uses, with no data migration and no change of platform.
The distributor on the way out does not stop paying and does not complain: the order shrinks month after month until it disappears. The churn index combines year-on-year decline, months without a purchase, OTIF, exclusivity, payment behavior and sales coverage into a single comparable score.
Alerts that fire on their own
Thresholds configurable by segment, region, type and account manager. A sustained decline while paying on time, months without a purchase and an active distributor with no visit all flag themselves, while there is still time to call.
- CRITICAL143 distributors fell more than 12% over twelve months while paying on time and without a single complaint.
- WARNING32 active distributors with no sales visit for twelve months.
- INFOThe largest decile concentrates 38.4% of volume: 120 relationships carry half the business.
One engine, every industry
What changes between modules is the unit the industry already decides with and the thresholds that trigger its alerts. The calculation layer, the traceability and the delivery are identical. How the model works, in four stages.
This module falls under the same plans as the rest. See plans and pricing.
Send us twelve months of deliveries and we will show you what comes out of it.
Thirty minutes is enough to see how much volume in your network is falling today without any report picking it up. No cost, no commitment.