Demo model · Public data · Energy
Energy Matrix: from data to decision.
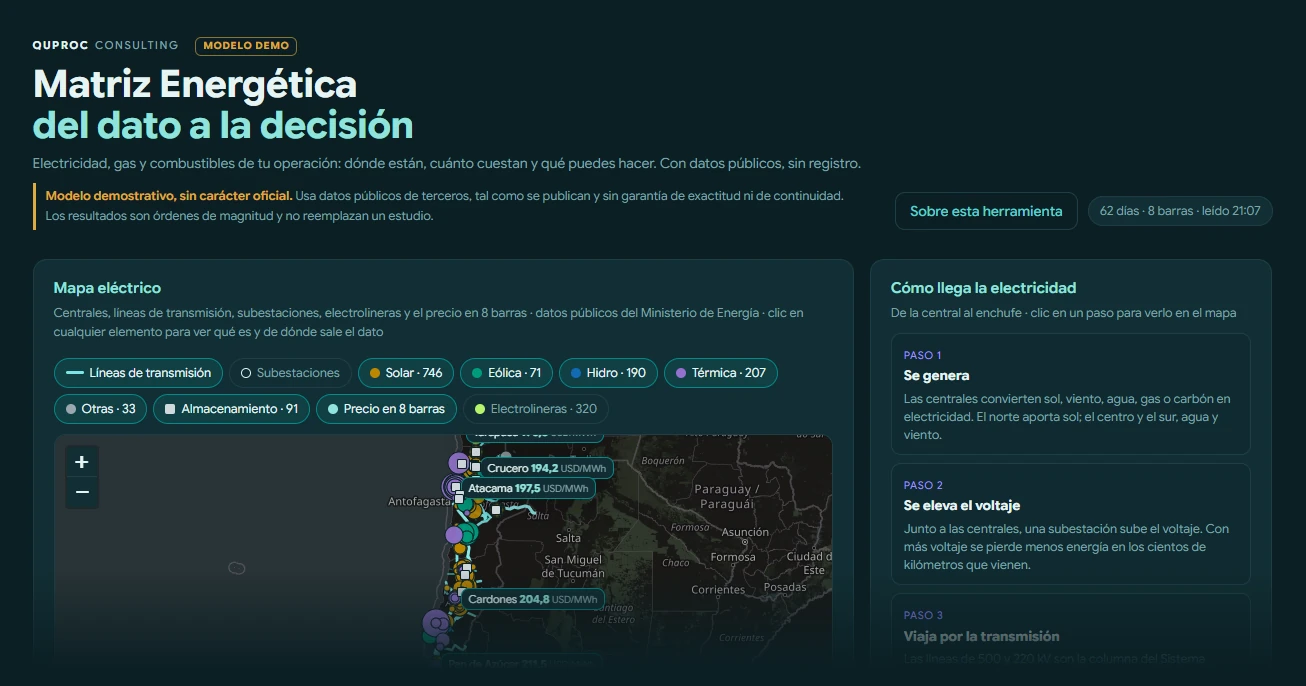
Electricity, gas and fuels in one model: where they are, what they cost and what happens if you change a variable. Built only on public data and open without sign-up.
Demo model
Demo model built on public data from Chile’s National Electric Coordinator, the Ministry of Energy, the National Energy Commission (CNE) and the tariff schedules of the distributors. The sample companies are fictitious. Results are orders of magnitude and do not replace a study. The web app is in Spanish.
How it is built, in Quproc’s three stages.
Each stage is a tab in the app. The industry and region filter cuts across every view.
01 · MappingWhere everything is
A map with power plants by technology, transmission lines, substations and EV charging stations, plus the price at the system’s reference nodes. The gas and fuels track does the same with natural gas, LNG, LPG and diesel.
02 · ModelingWhat it costs and when
Hour-by-hour marginal cost, live and historical, the typical day and generation by technology, in USD/MWh or CLP/kWh. Regulated tariffs are read from each distributor’s tariff schedule.
03 · SimulationWhat happens if you change something
An electricity simulator and a thermal one on a sample company by industry and region. You move consumption, schedule or tariff and see the effect on the total energy cost. The calculation runs in your browser.
Here the topic is energy. In your company, the path is the same.
The sources become your invoices, meters and spreadsheets, and the model crosses the cost of energy with your operation: by area, by product and by month.
Sources
- National Electric Coordinator · public information and operations APIs
- Ministry of Energy · IDE Energía
- National Energy Commission
- Tariff schedules of the electricity and gas distributors
Public data, cited with its source. The official versions are those of each institution.
The other demonstrations
Tell us which process you want to organize and we will show you the path.
Thirty minutes to see whether your operation fits one of the models already built. No cost, no commitment.