Public data models · demonstration

The Quproc method, on data anyone can look up.

Five models built only on public data: Chile’s energy matrix, the projects that go through the SEIA environmental assessment system, their map over the country’s infrastructure, the financial statements published by the CMF and the Chilean salmon farming benchmark. They follow the same three stages Quproc uses inside a company: mapping, modeling and simulation.

Public data models

They use public data only, cite their sources and open without sign-up. The web apps are in Spanish. The demo models are demonstrations, not formal tools: whatever you type is calculated in your browser and is not stored. The sample companies in the Energy Matrix are fictitious; the companies in the CMF and SEIA models appear because they are registered with the CMF or have projects under assessment, not as clients or cases, and project owners who are individuals appear as “Persona natural”. In the salmon farming benchmark, every company appears without its name. None of this is investment advice.

Five topics, the same path.

Energy, projects under environmental assessment, territory, finance and a whole industry. Each one opens in its own web app, in a new tab.

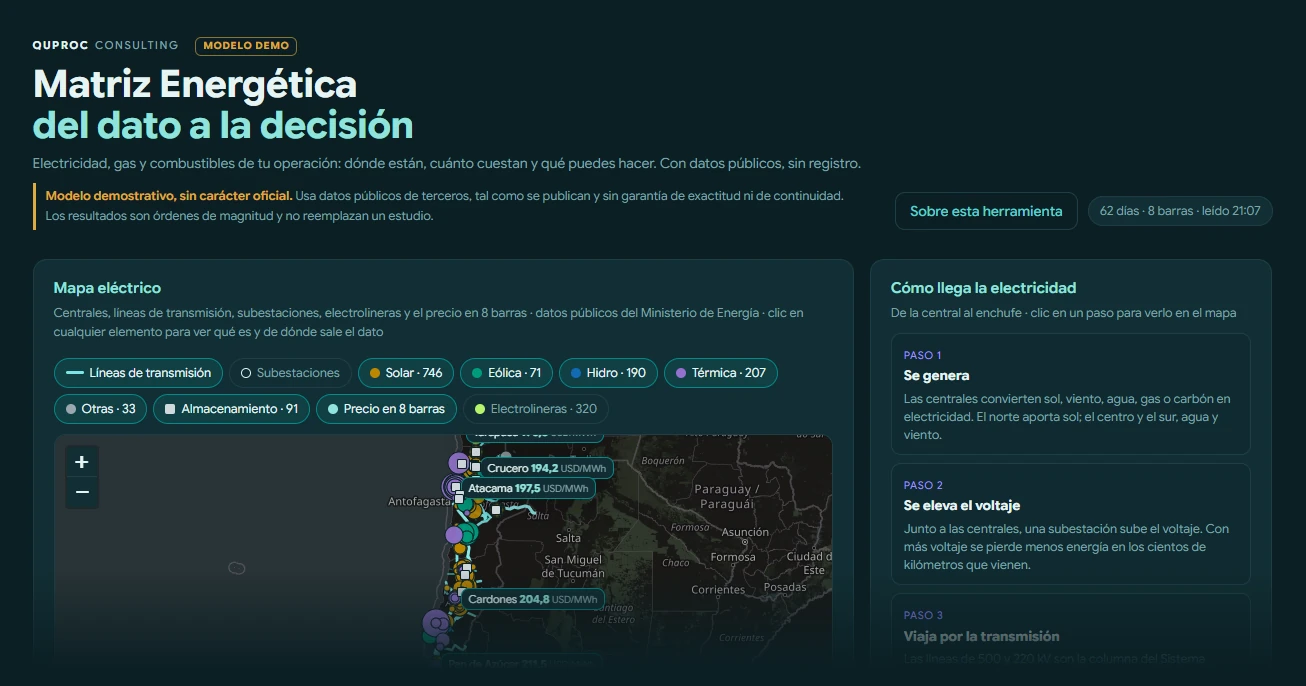
Energy Matrix, a Quproc demo model: header with the demo model seal, tabs by stage and layers of the power map
Operations · Energy

Energy Matrix

Electricity, gas and fuels in one model: where they are, what they cost and what happens if you change consumption, schedule or tariff.

National Electric Coordinator · Ministry of Energy · CNE · electricity and gas distributors

SEIA Chile, a Quproc demo model: the five sectors, the views by group and the indicators for projects, investment, success rate and assessment
Investment · Environmental assessment

SEIA Chile

More than 17,000 projects across five sectors: what gets approved, where, who is behind it, which permits they need and where each one stands.

Environmental Assessment Service (SEA) · e-SEIA

SEIA and infrastructure map, a Quproc demo model: SEIA projects with substations and transmission lines in central Chile
Territory · Infrastructure

SEIA and infrastructure map

SEIA projects over the power grid, fuels and mining, with each one’s distance to the nearest substation, line or mining site.

SEA · National Electric Coordinator · Ministry of Energy · Sernageomin · Consejo Minero

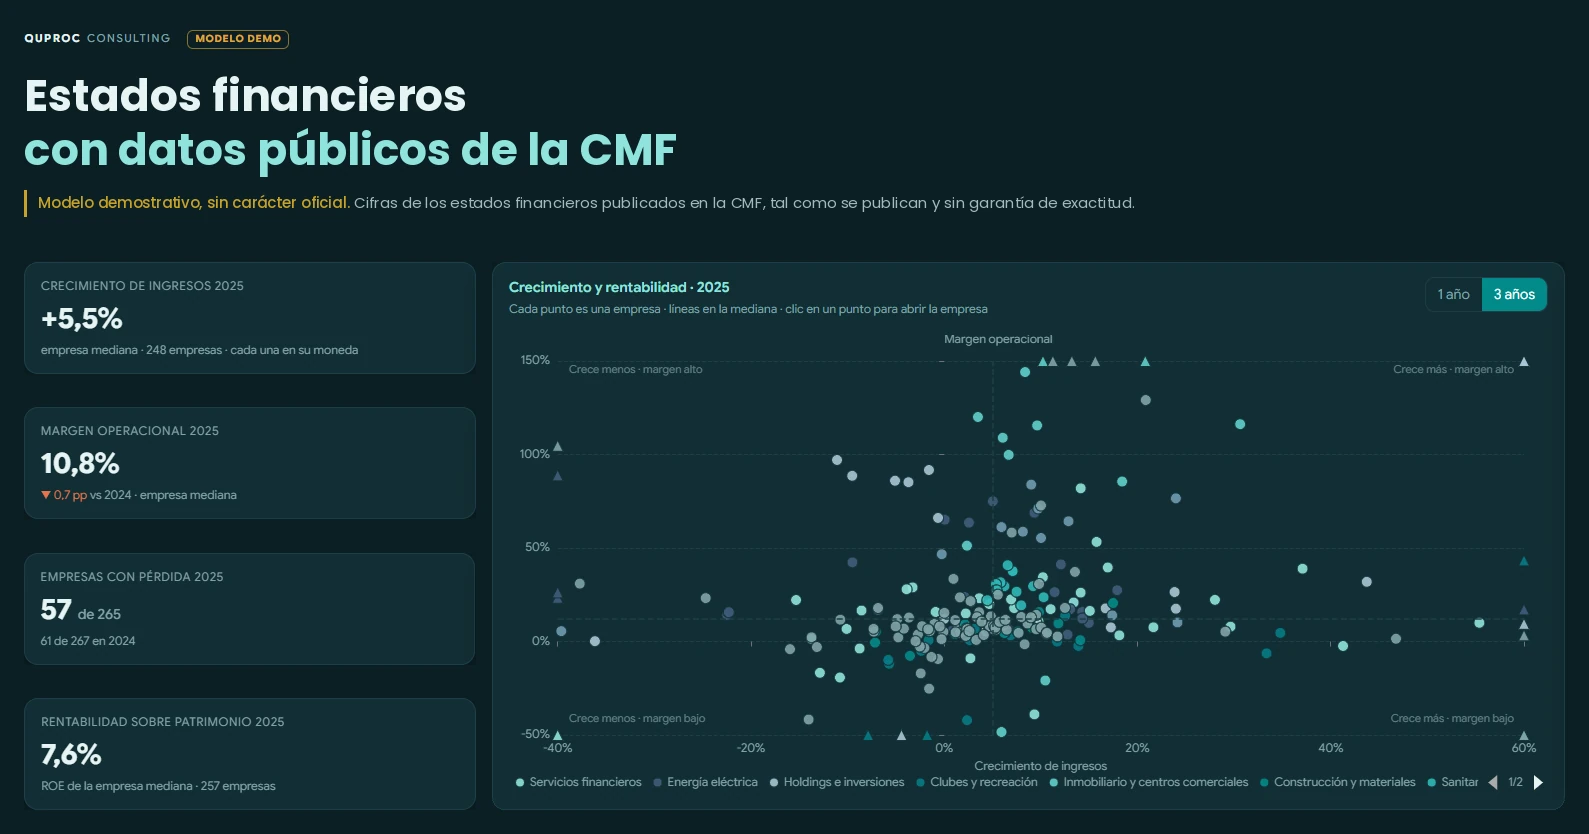
CMF financial statements, a Quproc demo model: aggregate indicators for the year and growth against margin by company
Finance · Financial statements

CMF financial statements

The IFRS statements published by the CMF, in one chart of accounts and with the same indicators for every company. Each figure opens its source.

Financial Market Commission (CMF)

Chilean salmon farming benchmark by Quproc: tabs by stage and the data matrix with the source of each figure
Industry · Salmon farming

Chilean salmon farming benchmark

What each producer publishes, site by site: 24 indicators across 5 dimensions, the same for everyone. If someone does not publish a figure, the gap is visible.

Sernapesca · SMA · Subpesca · SEA · CMF · company reports

The same three stages as inside a company.

What changes from one model to another are the sources and the vocabulary. The order of the work is the same.

Model01 · Mapping02 · Modeling03 · Simulation
Energy Matrix Power plants, lines, substations and EV charging stations on a map, with the price at the system’s nodes. Hour-by-hour marginal cost, its history, the typical day and generation by technology. A sample company by industry and region: you move consumption, schedule or tariff and see the effect on cost.
SEIA Chile Projects from five sectors of the e-SEIA in one table, with their project pages, RCAs, permits and observations. Thirteen views: what gets approved, where, which technologies, who the owners are and how long the process takes. Each project by its moment, the permits it will probably need and side-by-side comparison.
SEIA and infrastructure map SEIA projects over thirteen layers of electricity, fuels and mining. Each project’s distance to the nearest infrastructure, with the voltage of the substation and of the line. Proximity filters combined with sector, status or investment to build scenarios.
CMF financial statements The CMF’s current list and each company’s IFRS statements, consolidated or separate. One chart of accounts for every company, with each indicator’s formula in view. Simulator and comparison on the same figures already organized, company against company.
Salmon farming benchmark What each producer publishes and what Sernapesca, the SMA, Subpesca and the CMF record, with a matrix of what there is for each one. 24 indicators across 5 dimensions, the same for everyone, and views by area, site and producer. Simulator and comparison on the financial figures of the listed companies.

Tell us which process you want to organize and we will show you the path.

Thirty minutes to see whether your operation fits one of the models already built. No cost, no commitment.